Difference between revisions of "Keyword:NUCGRAPH"
(Created page with " {{big|'''NUCGRAPH''' ''numg floor uncert nopt(i), i''}}''=''{{big|''1,numg''}} ---- This keyword creates data output files as <tt><fileroot>.grn</tt> and <tt><fileroot>.pln...") |
Mark Gilbert (Talk | contribs) |
||
| (5 intermediate revisions by the same user not shown) | |||
| Line 1: | Line 1: | ||
| − | |||
{{big|'''NUCGRAPH''' ''numg floor uncert nopt(i), i''}}''=''{{big|''1,numg''}} | {{big|'''NUCGRAPH''' ''numg floor uncert nopt(i), i''}}''=''{{big|''1,numg''}} | ||
---- | ---- | ||
| − | This keyword creates data output files as <tt><fileroot>.grn</tt> and <tt><fileroot>.pln</tt> that contain the data and <tt>gnuplot</tt> plotting instructions for the total and dominant nuclide contributions for a set of output | + | This keyword creates data output files as <tt><fileroot>.grn</tt> and <tt><fileroot>.pln</tt> that contain the data and <tt>gnuplot</tt> plotting instructions for the total and dominant nuclide contributions for a set of requested output graphs. The number of graphs required (numg) is input, and for each graph an option number (nopt(i)) is read. Allowable values for the options are: |
# specific activity | # specific activity | ||
| Line 16: | Line 15: | ||
The <tt>topx</tt> and <tt>topxx</tt> inputs from the [[Keyword:SORTDOMINANT | '''SORTDOMINANT''']] keyword may be used to limit or expand the number of dominant contributions considered. The <tt>floor</tt> argument specifies the cutoff for a dominant contribution to be plotted. Only those curves that contribute more than the <tt>floor</tt> percentage of the total value are included in the graph data. | The <tt>topx</tt> and <tt>topxx</tt> inputs from the [[Keyword:SORTDOMINANT | '''SORTDOMINANT''']] keyword may be used to limit or expand the number of dominant contributions considered. The <tt>floor</tt> argument specifies the cutoff for a dominant contribution to be plotted. Only those curves that contribute more than the <tt>floor</tt> percentage of the total value are included in the graph data. | ||
| − | The <tt>uncert</tt> argument allows the user to plot the [[Keyword:UNCERTAINTY | '''UNCERTAINTY''']] pathways-based uncertainty data using <tt>uncert=1</tt> or the uncertainty may be ignored using <tt>uncert=0</tt>. | + | The <tt>uncert</tt> argument allows the user to plot the [[Keyword:UNCERTAINTY | '''UNCERTAINTY''']] pathways-based uncertainty data (for the total response only) using <tt>uncert=1</tt> or the uncertainty may be ignored using <tt>uncert=0</tt>. |
This keyword requires the user to specify a <tt>gnuplot</tt> style file as <tt>ng_style</tt> within the <tt>files</tt> file to generate the full plot script, which may be plotted using | This keyword requires the user to specify a <tt>gnuplot</tt> style file as <tt>ng_style</tt> within the <tt>files</tt> file to generate the full plot script, which may be plotted using | ||
| Line 26: | Line 25: | ||
Example usage of the keyword: | Example usage of the keyword: | ||
| − | + | <pre> < -- Control phase -- > | |
... | ... | ||
FISPACT | FISPACT | ||
| Line 36: | Line 35: | ||
< -- Inventory phase -- > | < -- Inventory phase -- > | ||
... | ... | ||
| + | </pre> | ||
| + | The default <tt><fileroot>.pln</tt> created by this keyword should be treated as a guiding template only - the user should modify it to produce visually acceptable output. | ||
| + | |||
| + | Example plots of <tt><fileroot>.grn</tt> files (using modified versions of <tt><fileroot>.pln</tt>): | ||
| + | |||
| + | |||
| + | |||
| + | [[File:FE_DEMO-FW_Activity_nuclides.png|600px|thumb|left|Becquerel activity from pure iron after a 2 year irradiation under fusion power plant conditions]] | ||
| + | |||
| + | [[File:W_DEMO-FW_Heat_nuclides.png|600px|thumb|center|Decay heat from pure tungsten after a 2 year irradiation under fusion power plant conditions]] | ||
| + | |||
| + | [[File:SN_DEMO-FW_DR_nuclides.png|600px|thumb|right|Contact gamma dose rate from pure tin after a 2 year irradiation under fusion power plant conditions]] | ||
Latest revision as of 11:59, 22 July 2020
NUCGRAPH numg floor uncert nopt(i), i=1,numg
This keyword creates data output files as <fileroot>.grn and <fileroot>.pln that contain the data and gnuplot plotting instructions for the total and dominant nuclide contributions for a set of requested output graphs. The number of graphs required (numg) is input, and for each graph an option number (nopt(i)) is read. Allowable values for the options are:
- specific activity
- specific total heat
- gamma dose rate
- specific gamma heat
- specific beta heat
- specific ingestion
- specific inhalation
The topx and topxx inputs from the SORTDOMINANT keyword may be used to limit or expand the number of dominant contributions considered. The floor argument specifies the cutoff for a dominant contribution to be plotted. Only those curves that contribute more than the floor percentage of the total value are included in the graph data.
The uncert argument allows the user to plot the UNCERTAINTY pathways-based uncertainty data (for the total response only) using uncert=1 or the uncertainty may be ignored using uncert=0.
This keyword requires the user to specify a gnuplot style file as ng_style within the files file to generate the full plot script, which may be plotted using
gnuplot <fileroot>.pln
Example usage of the keyword:
 < -- Control phase -- >
 ...
 FISPACT
 * Title of the simulation
 < -- Initial phase -- >
 ...
 NUCGRAPH 7 0.01 1  1 2 3 4 5 6 7
 ...
 < -- Inventory phase -- >
 ...
The default <fileroot>.pln created by this keyword should be treated as a guiding template only - the user should modify it to produce visually acceptable output.
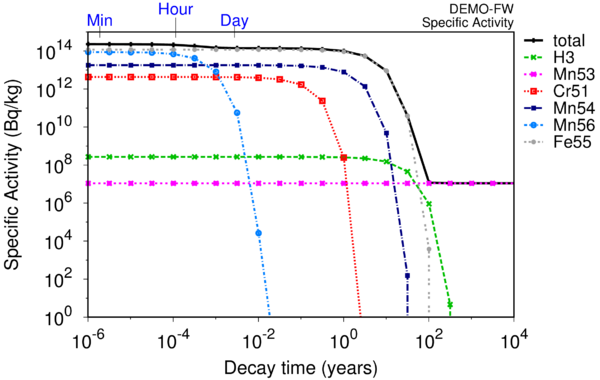
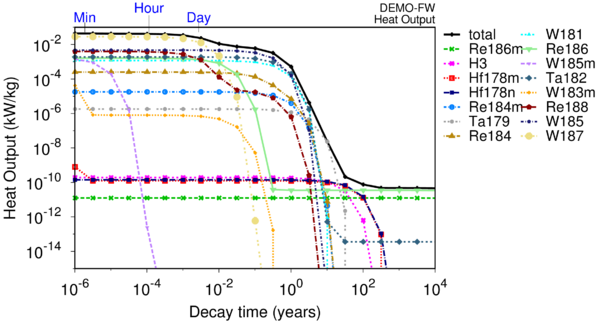
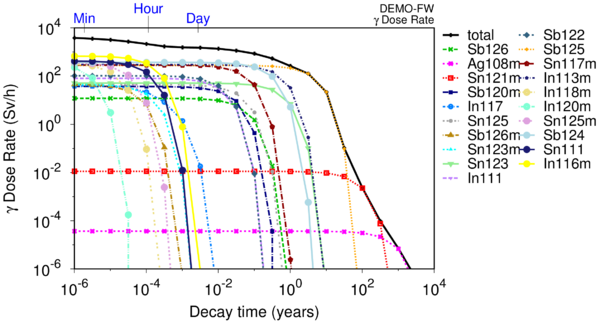
Example plots of <fileroot>.grn files (using modified versions of <fileroot>.pln):


